TYRE INTELLIGENCE
Allow your tyres to collect all the data you need
(CLICK A THUMBNAIL BELOW FOR MORE)
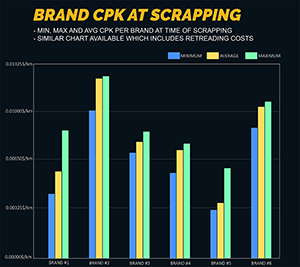

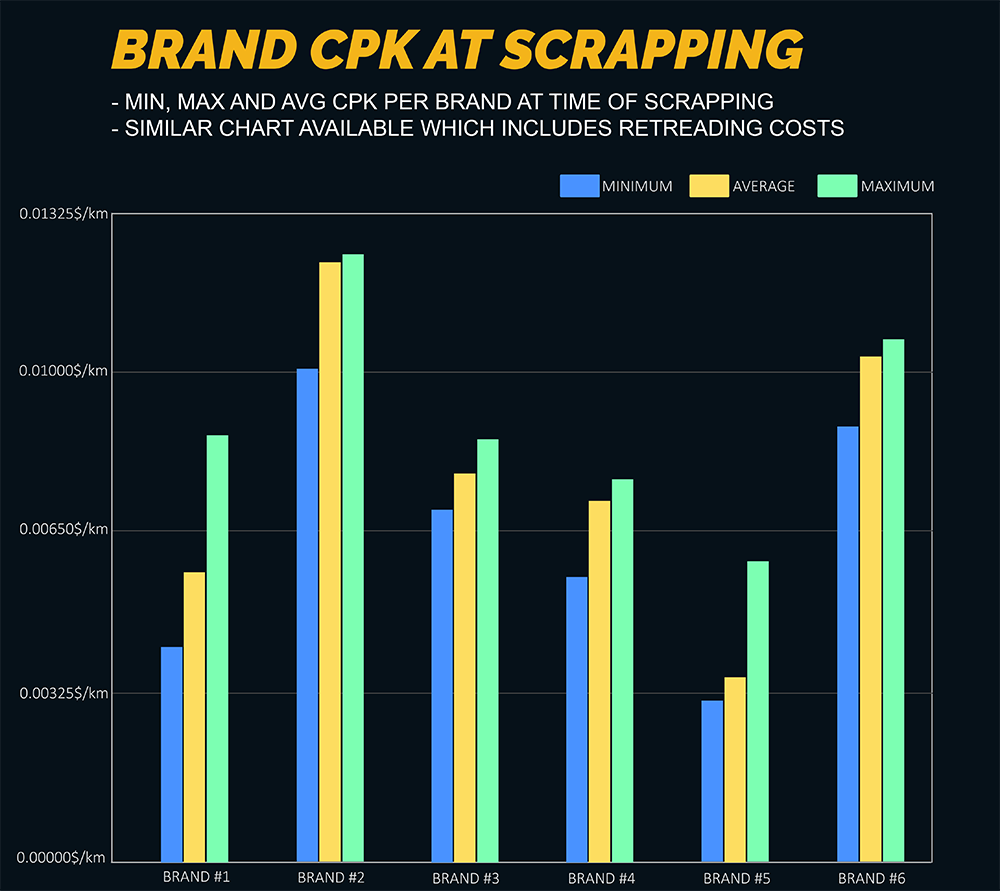
Cost per kilometer
Fleetsense connects in the background with your GPS tracking software to retrieve vehicle mileages on an hourly basis. Our algorythms calculate and apply mileage increases to every tyre in your fleet, regardless of location or movement between different vehicles. You enter casing and retread prices, and we do the rest. This chart shows actual CPK values for every brand in your fleet.
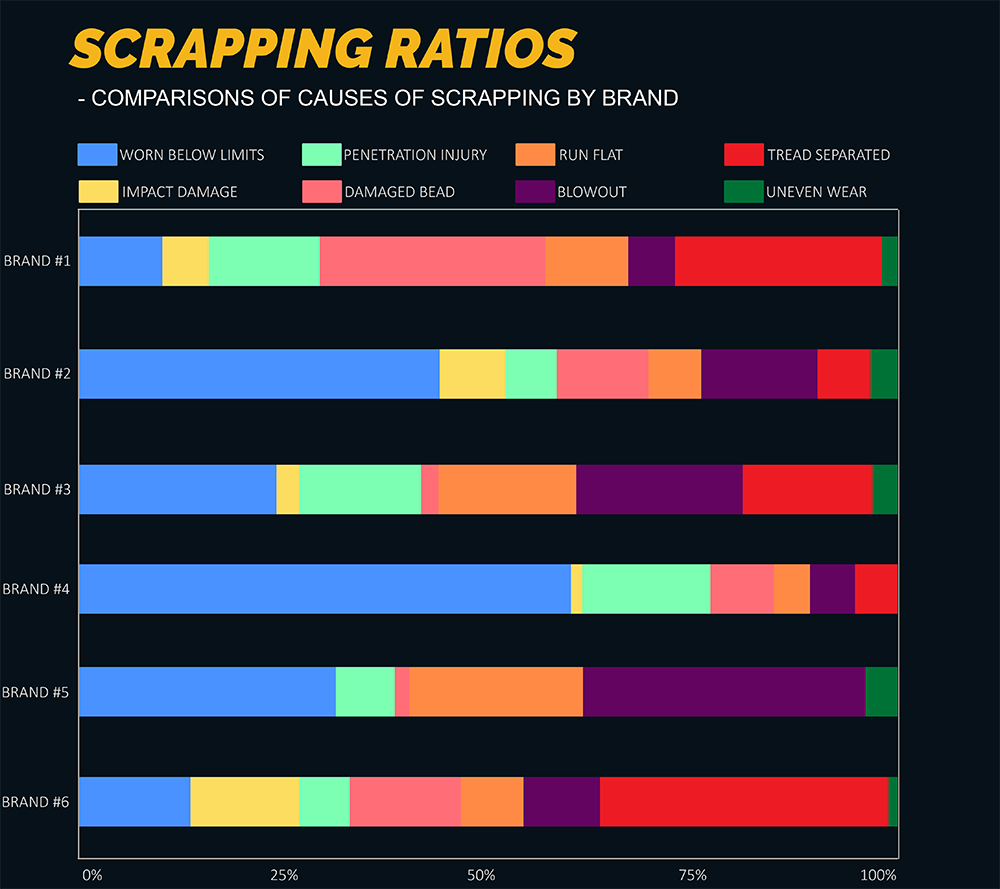
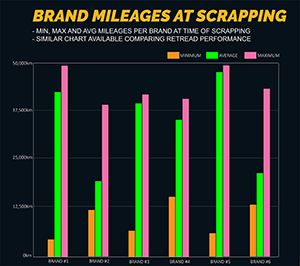
INSIGHTS ON TYRE SCRAPPING
Tyre scrapping is conducted with our handheld scanners or from the web-app. Photos are submitted for each scrapped tyre and a scrapping reason supplied. This data compiles into charts like these, highlighting scrapping ratios, and which casing brands deliver the best performance.
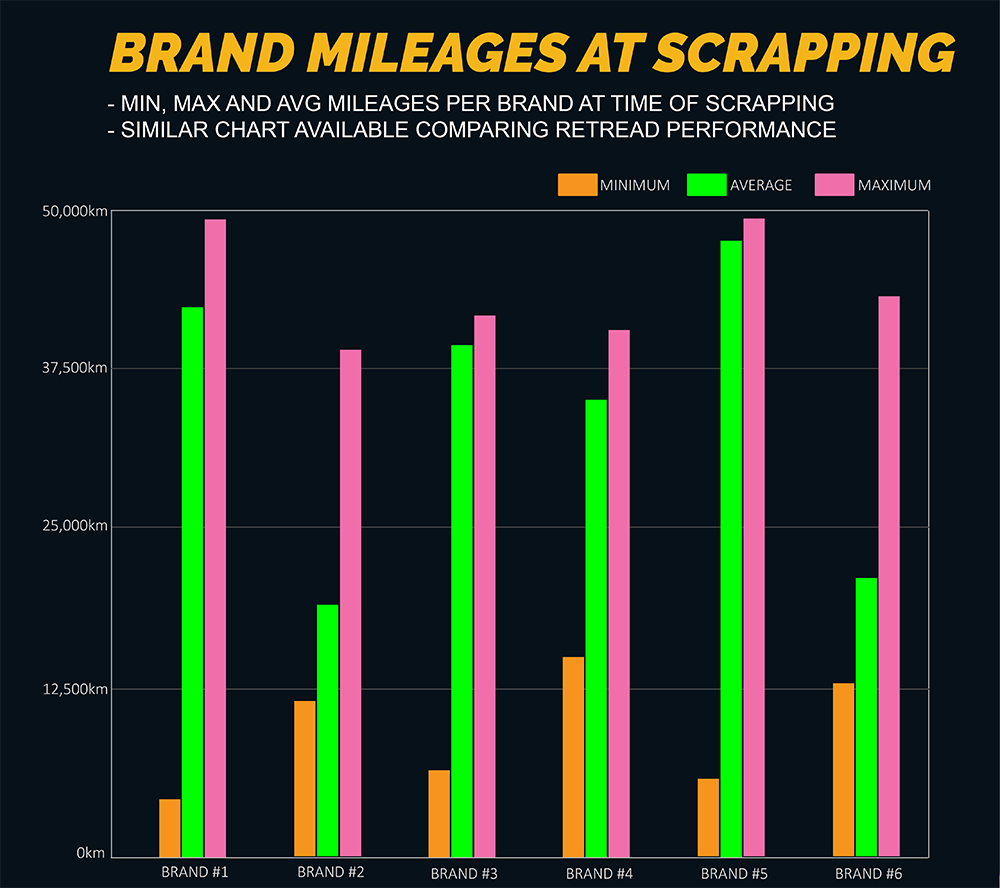
Casing Mileage Comparisons
A different way to view scrapping data, this chart allows the user to compare tyre lifetimes, not only between tyre manufacturers, but also between retreading facilities.

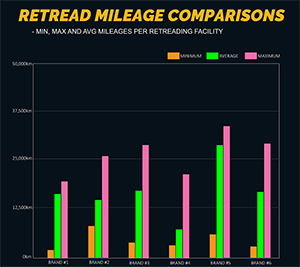
Retread Mileage Comparisons
The chart some retreading facilities don't want you to see. With this data you will know who to use and who to stay away from.
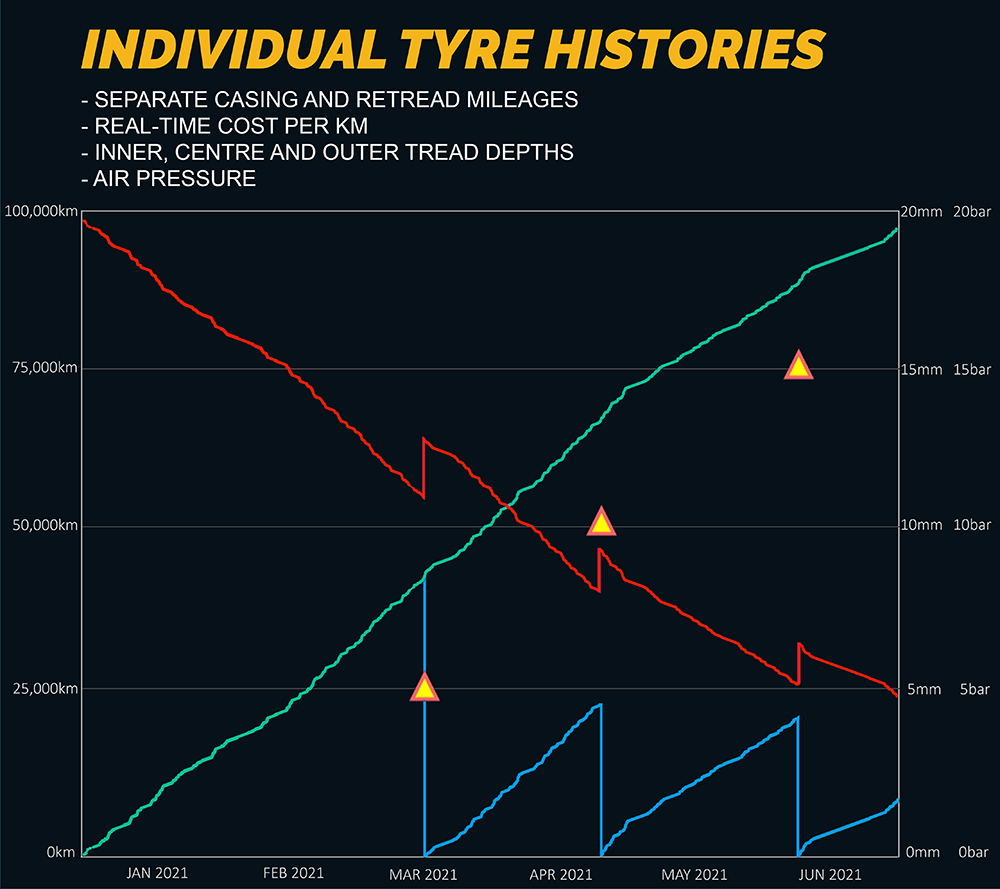
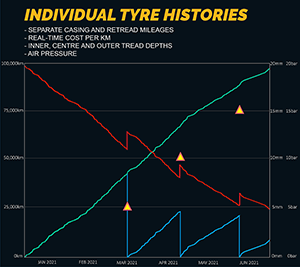
INDIVIDUAL TYRE HISTORIES
Each tyre in your fleet builds up a complete history which details real-time CPK, casing and current retread mileages, retread events, tread depths (outer, centre & inner) and air pressures. Charts do not have to be watched for anomalies, our system notifies you electronically whenever submitted measurements are out of range.
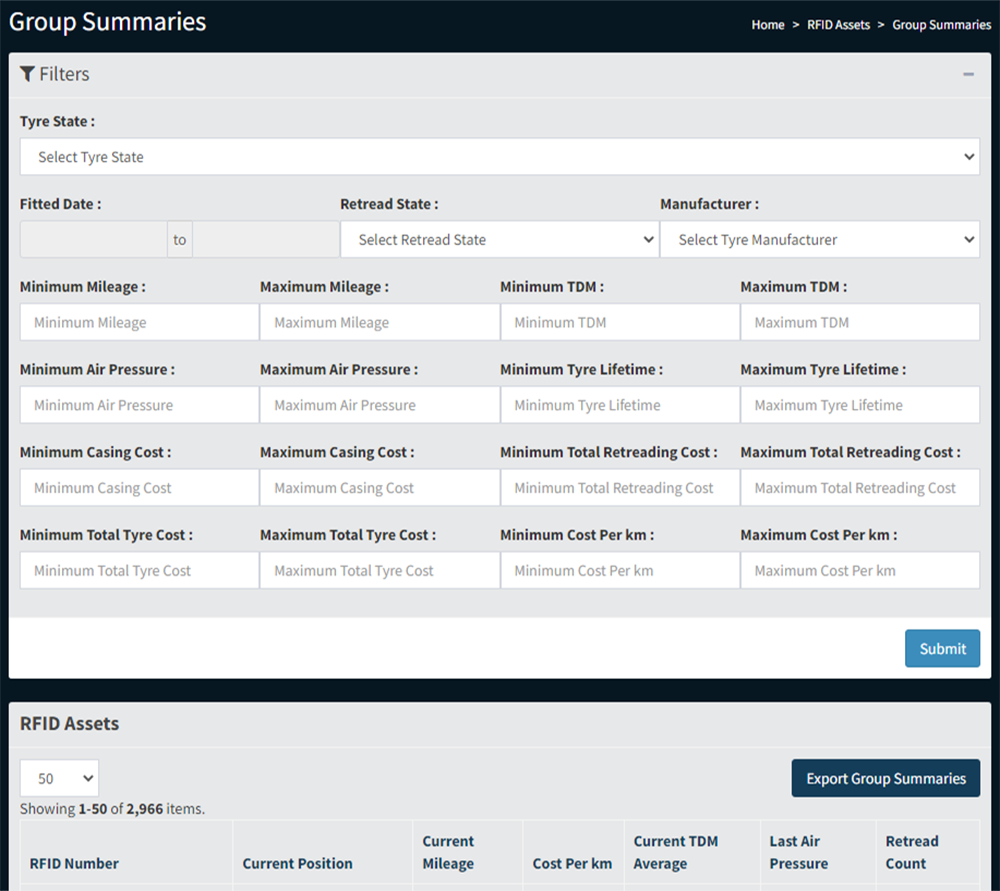
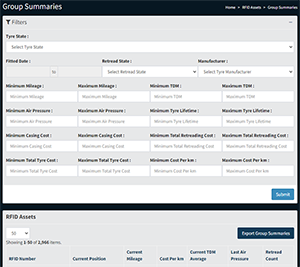
GROUP SUMMARIES
Compile custom reports within seconds using our intuitive group reports function. Select from a wide range of filters to compile a list of your desired sample list and export all data in .csv format for secondary processing.
Automated GPS Tyre Mileages
This Fleetsense module links up with your existing GPS tracking company and regularly collects your vehicle mileages in the background. It then automatically applies mileage increases to every tyre in your fleet. This, together with manually entered casing and retreading costs, allows Fleetsense to deliver to our users the most accurate and effortless automated mileages and cost/km for every tyre in your fleet.
Comprehensive group reports
Fleetsense allows you to generate a report on your fleet's tyres in no time. Select your sample group through the following filters: tyre state, vehicle type, tyre position, fitted date range, retread state, manufacturer, min/max mileage, min/max tread depths, min/max air pressure, min/max tyre lifetime, min/max casing cost, min/max retreading cost, min/max total tyre cost, min/max cost per km.
Charts: Cost per km comparisons by brand
When a tyre is scrapped the system logs its final cost/km value. Fleetsense converts all this scrapping data into easy to understand charts showing the cost/km comparisons between the different manufacturers in your fleet. All the user needs to do is batch enter tyre costs, Fleetsense does all the rest.
Charts: Scrapping ratios
Scrapping a tyre using our mobile app requires the operator to submit a reason for scrapping from a standard list. This scrapping data is processed and displayed as a scrapping ratios chart, showing the user how different brands compare and what percentages the different scrapping reasons make up for each brand.
Charts: Brand Mileages
Total casing mileage is also logged when a tyre is scrapped. This chart compares the minimum, average and maximum mileages at time of scrapping for the different tyre brands in your fleet.
Charts: Retreading Comparisons
For fleets who use retreaded tyres we have made available the same charts as above, but comparing retreading facilities instead of casing manufacturers.
Get in touch
we would like to hear from you